Means
Sample Results as an Excel Table:
| Means | |||||
| Variable: | Price | ||||
| grouped by: | Size | ||||
| and by: | New or Used | ||||
| 95% | |||||
| N | Mean | Conf. (±) | Std.Error | Std.Dev. | |
| new | 34 | 11804.79412 | 1903.658079 | 935.6813819 | 5455.913127 |
| compact | 6 | 5451 | 1980.927604 | 770.6144734 | 1887.612248 |
| large | 18 | 14888.38889 | 2669.446266 | 1265.250969 | 5368.00524 |
| medium | 10 | 10066.6 | 1328.516098 | 587.2784159 | 1857.137415 |
| used | 38 | 3998.447368 | 665.6176793 | 328.5066272 | 2025.050853 |
| compact | 8 | 2618.625 | 1318.870424 | 557.7505183 | 1577.556695 |
| large | 10 | 4778.5 | 971.7990992 | 429.5895522 | 1358.481444 |
| medium | 20 | 4160.35 | 1051.240169 | 502.2589879 | 2246.170478 |
| Entire sample | 72 | 7684.777778 | 1316.230644 | 660.114329 | 5601.255821 |
... and as an Excel Chart:
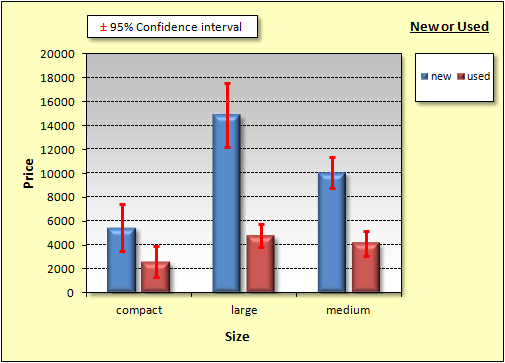
The selectable error bars are:
- Standard deviation
- Standard error of mean
- Confidence interval (choose any %)