Quality Control Plots
Types of control plots:
- X-bar (sample mean)
- R (range)
- S (standard deviation)
- p (fraction nonconforming)
- np (number nonconforming)
- c (count of conconformances)
- u (count of nonconformances per unit)
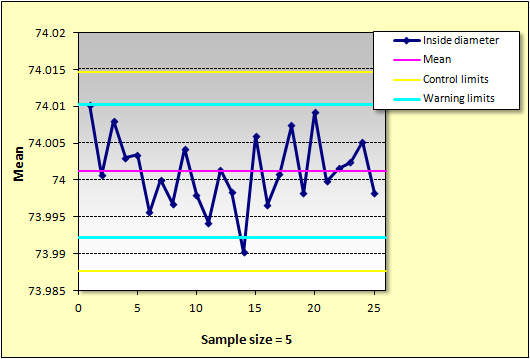
Displayable lines:
- Mean of all measurements
- Control limits
- Warning limits
- Specification value (X-bar only)
- upper and lower specification limits (X-bar only)
Sample Results as an Excel Chart: