Survival Analysis (Cox-Regression)
Sample Results as an Excel Table:
| Cox regression | |||||
| Survival time: | Survival Time | ||||
| Event: | Death | ||||
| X-Variables: | Treatment numeric | ||||
| Age | |||||
| Method: | Direct | ||||
| Steps | P | -2 Log- Likelihood |
Chi-Square | Degrees of Freedom | P Total |
| Treatment numeric(+) | ---- | ---- | ---- | ---- | ---- |
| Age(+) | ---- | ---- | ---- | ---- | ---- |
| Equation | |||||
| 95% | Hazard = | ||||
| Coefficient | Conf. (±) | Std.Error | P | Exp(Coef.) | |
| Treatment numeric | 0.97236485 | 1.81935207 | 0.92824667 | 0.29485592 | 2.6441902 |
| Age | 0.09701086 | 0.22328821 | 0.11392327 | 0.39446635 | 1.10187234 |
| Survival table | |||||
| Cumulative Hazard Rate, Baseline | at Covariate Mean | Survival Probability, Cursive case | |||
| Survival time | Survival Probability | Cumulative Hazard Rate | |||
| 21 | 0.00030755 | 0.95108341 | 0.05015351 | ---- | |
| 42 | 0.00069007 | 0.89356855 | 0.11253222 | ---- | |
| 55 | 0.00110832 | 0.83465523 | 0.18073654 | ---- | |
| 69 | 0.00161467 | 0.76850455 | 0.2633088 | ---- | |
| 130 | 0.00288931 | 0.62427243 | 0.47116841 | ---- | |
| 210 | 0.00392335 | 0.52740174 | 0.6397927 | ---- | |
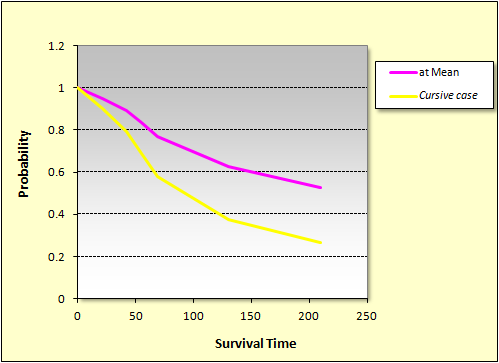
Sample Results as an Excel Chart:
The curve displays the survival probabilites of an average individual ("at Mean"). Optionally, the survival curve of a specific individual with known input values ("Cursive case") may be displayed in contrast.