Factor Analysis
Sample Results as an Excel Table:
| Factor analysis | |||
| Valid cases: | 72 | ||
| Communalities | |||
| Analysis | |||
| Estimated | 1 | 2 | |
| Size of Household | 0.968772187 | 0.974583087 | 0.982000553 |
| Children | 0.968772187 | 0.961077575 | 0.957530518 |
| Income | 0.687608223 | 0.662323338 | 0.654818854 |
| Price | 0.795649889 | 0.760234923 | 0.745369652 |
| Horsepower | 0.795649889 | 0.812692287 | 0.835740566 |
| Mileage | 0.568507348 | 0.448451908 | 0.407352015 |
| Eigenvalues | |||
| Factor | Eigenvalue | Variance (percent) | Percent cumulative |
| 1 | 2.528398864 | 42.13998107 | 42.13998107 |
| 2 | 2.054413295 | 34.24022158 | 76.38020264 |
| 3 | 0.11343751 | 1.890625169 | 78.27082781 |
| 4 | 0.074328111 | 1.238801842 | 79.50962965 |
| 5 | 0.012614332 | 0.210238864 | 79.71986852 |
| 6 | 0.01005589 | 0.167598164 | 79.88746668 |
| Varimax factor loadings | |||
| Factor 1 | Factor 2 | Commu-nality | |
| Size of Household | 0.98980908 | -0.047734045 | 0.982000553 |
| Children | 0.971614198 | -0.11617387 | 0.957530518 |
| Income | 0.702919986 | 0.400901917 | 0.654818854 |
| Horsepower | -0.039820597 | 0.913320801 | 0.835740566 |
| Price | -0.12425403 | 0.854359753 | 0.745369652 |
| Mileage | -0.24340756 | -0.590004046 | 0.407352015 |
| Sum of Squares | 2.494124655 | 2.088687504 | 4.582812159 |
| Percent of Variance | 41.56874425 | 34.81145839 | 76.38020264 |
Sample Results as an Excel Chart:
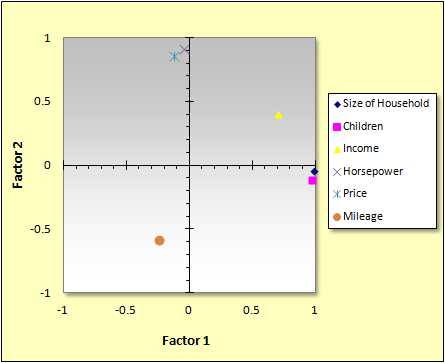
If there are more than two factors, the two which are displayed in the chart can be chosen freely.