Simple Regression
Sample Results as an Excel Table:
| Simple regression | |||||
| X-Variable: | Horsepower | ||||
| Y-Variable: | Mileage | ||||
| N | A | B | R | R-Square | |
| Y = A + B*X | 72 | 20.27266145 | -0.048712126 | 0.568507348 | 0.323200605 |
| Y = A * X^B | 72 | 68.31853762 | -0.342707381 | 0.684551601 | 0.468610895 |
| Y = A * e^(B*X) | 72 | 20.06746357 | -0.00298937 | 0.594547263 | 0.353486447 |
| Y = A + B*ln(X) | 72 | 41.52073474 | -5.879421715 | 0.68914352 | 0.474918791 |
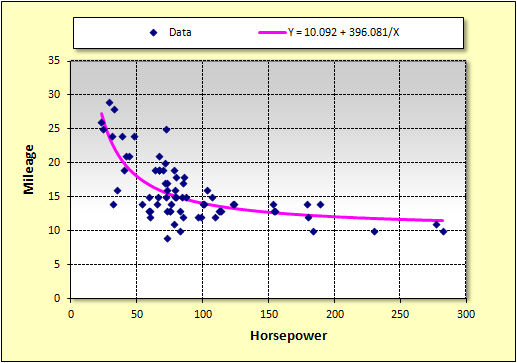
| Y = A + B/X | 72 | 10.09198984 | 396.0812058 | 0.723111483 | 0.522890217 |
| Y = 1 / (A + B*X) | 72 | 0.049866116 | 0.000194645 | 0.606364426 | 0.367677817 |
| Y = X / (A + B*X) | 72 | -1.311113503 | 0.086562344 | 0.638929317 | 0.408230672 |
Sample Results as an Excel Chart: