Frequencies
(with Histogram)
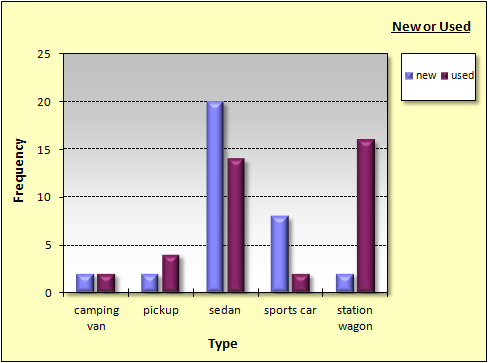
Sample Results as an Excel Table:
| Frequencies | |||
| Variable: | Type | ||
| grouped by: | New or Used | ||
| Frequency | Percent | Cumulative Percent | |
| new | 34 | 47.22 | 47.22 |
| camping van | 2 | 5.88 | 5.88 |
| pickup | 2 | 5.88 | 11.76 |
| sedan | 20 | 58.82 | 70.59 |
| sports car | 8 | 23.53 | 94.12 |
| station wagon | 2 | 5.88 | 100.00 |
| used | 38 | 52.78 | 100.00 |
| camping van | 2 | 5.26 | 5.26 |
| pickup | 4 | 10.53 | 15.79 |
| sedan | 14 | 36.84 | 52.63 |
| sports car | 2 | 5.26 | 57.89 |
| station wagon | 16 | 42.11 | 100.00 |
... and as an Excel Chart:
If a single variable is chosen, the histogram is drawn with a superimposed best-fit normal function:
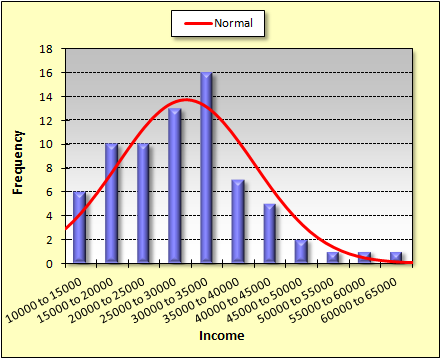
A plot of the cumulative frequencies can be produced with the "cumulative frequencies" command.