Survival Analysis (Kaplan-Meier Analysis)
WinSTAT offers two survival analysis features: Kaplan-Meier and Cox Regression.
Kaplan-Meier calculates and displays survival tables according to the data at hand and can also check if a single grouping variable has a significant influence on the survival probability curves.
Cox Regression allows the user to supply several independent variables which may or may not have a significant influence on the survival probability curves. A regression equation for the influence of these variables in then calculated. As with multiple linear regression, there are several options which cause WinSTAT to search for those variables which are significant. Another feature allows the user to plot a custom survival curve for a single row of data representing one patient or other item.
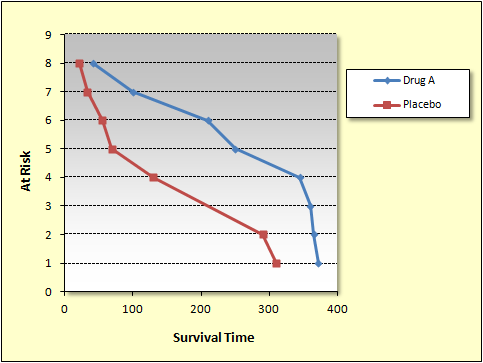
Sample Results as an Excel Table:
| Survival analysis | |||||
| Survival time: | Survival Time | ||||
| Event: | Death | ||||
| grouped by: | Treatment | ||||
| Survival Time | At Risk | Events | Censored | Survival Probability | Std.Error |
| Drug A | |||||
| 42 | 8 | 1 | 0 | 0.875 | 0.11692679 |
| 100 | 7 | 0 | 1 | ---- | ---- |
| 210 | 6 | 1 | 0 | 0.72916667 | 0.16497624 |
| 250 | 5 | 0 | 1 | ---- | ---- |
| 345 | 4 | 0 | 1 | ---- | ---- |
| 360 | 3 | 0 | 1 | ---- | ---- |
| 365 | 2 | 0 | 1 | ---- | ---- |
| 372 | 1 | 0 | 1 | ---- | ---- |
| Placebo | |||||
| 21 | 8 | 1 | 0 | 0.875 | 0.11692679 |
| 33 | 7 | 0 | 1 | ---- | ---- |
| 55 | 6 | 1 | 0 | 0.72916667 | 0.16497624 |
| 69 | 5 | 1 | 0 | 0.58333333 | 0.18556096 |
| 130 | 4 | 2 | 0 | 0.29166667 | 0.17284553 |
| 290 | 2 | 0 | 1 | ---- | ---- |
| 310 | 1 | 0 | 1 | ---- | ---- |
| Log-rank Test (Cox-Mantel) | |||||
| Events observed | Events expected | ||||
| Drug A | 2 | 4.14322344 | |||
| Placebo | 5 | 2.85677656 | |||
| Chi-square | Degrees of Freedom | P | |||
| 2.86972971 | 1 | 0.09026004 | |||
Sample Results as an Excel Chart: